Portfolio Analysis
Portfolio Analysis is based on the use of a Portfolio Matrix and is widely attributed to the Boston Consulting Group work originating in 1970. They proposed a structured method for organizations to comparatively assess the products or services in the portfolio.
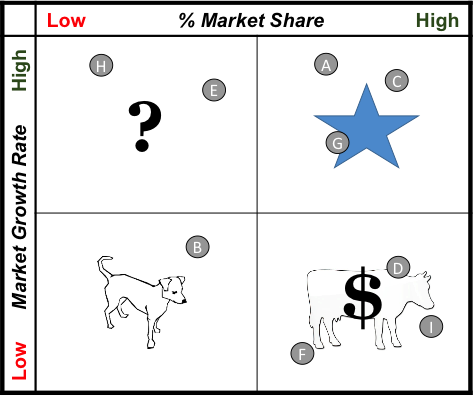 The heart of the method is a quadrant matrix where one axis is used to for plotting market share and the other the rate of market growth. The matrix is also divided with horizontal and vertical midlines into four equal quadrants. Each product or service is plotted on the matrix according to these two measures (see example at right).
The matrix is then used to assess the relative performance of each product or service based on its current position. This assessment is enriched by the understanding of what each quadrant represents. For example, the upper right quadrant, associated with both higher market share and higher market growth, represents the most favorable position, and products or services that are plotted in this area were originally referred to as “rising stars”. Conversely, those in the opposite quadrant (lower left, lower share and growth) were referred to as “dogs.”
Over the years, various kinds of organizations have adapted the basic construct by changing one or both axis to better reflect critical success factors in their specific industry. Some even use multiple matrixes to assemble a more comprehensive assessment of their portfolio.
One of the key insights gained from a Portfolio Analysis is an understanding of whether or not the portfolio is balanced or not. If the majority of products or services are clustered in just one or two quadrants, there are important ramifications that will likely challenge the organization.
SCS can help you construct, interpret, and respond to the findings of a portfolio analysis for your organization.