Statistical Process Control (SPC)
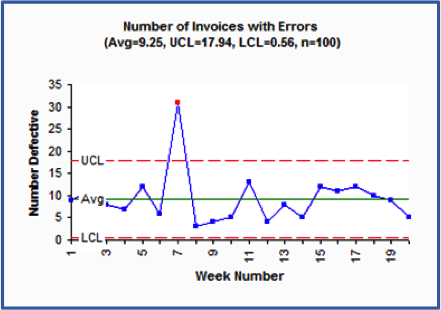 A key principle of all process and quality improvement is the use of data and measures to inform decision-making about where improvement is needed and when/if it has been achieved. Some of the specific tools include Run Charts and Control Charts, and the application of the statistical knowledge embodied in these tools in is referred to as Statistical Process Control (SPC). An example Control Chart appears at right.
These tools can reliably differentiate between movement in a particular measure that is simply random (should not be acted on) or special (assignable to a specific cause, such as an unusual and noteworthy circumstance, or an intentional change in the process). This is invaluable in helping managers know when to respond, and when not to.
SCS can help you leverage the power of SPC with:
- Education on the difference between enumerative (research) and analytic (SPC) statistics,
- Training on Run Chart and Control Chart...
- ...Construction
- ...Interpretation
- ...Selection and Application,
- Facilitation of the use Run Charts and Control Charts with key measures, including those in Dashboards and Balance Scorecards, and
Guidance on the use selection and use affordable SPC software, including the use of Excel.